Measuring content impact
Easily set up and measure the impact of your content items directly in Prepr.
Introduction
Content item metrics help you understand the impact of your content. See how many people you reach, how deeply they engage, and whether your content contributes to marketing goals and conversions. Use these insights to identify what works, improve underperforming content, and focus your efforts on content that delivers results.
Setting up content item metrics
You can view content metrics on content items when Prepr tracking is implemented in the front end and the feature is enabled for certain content items.
The metrics are visible in the content item list in the VIEWS column. The metric value is the total number of views for that content item ever. When you hover over the graph, the tooltip shows you the number of views in the last 7 days.
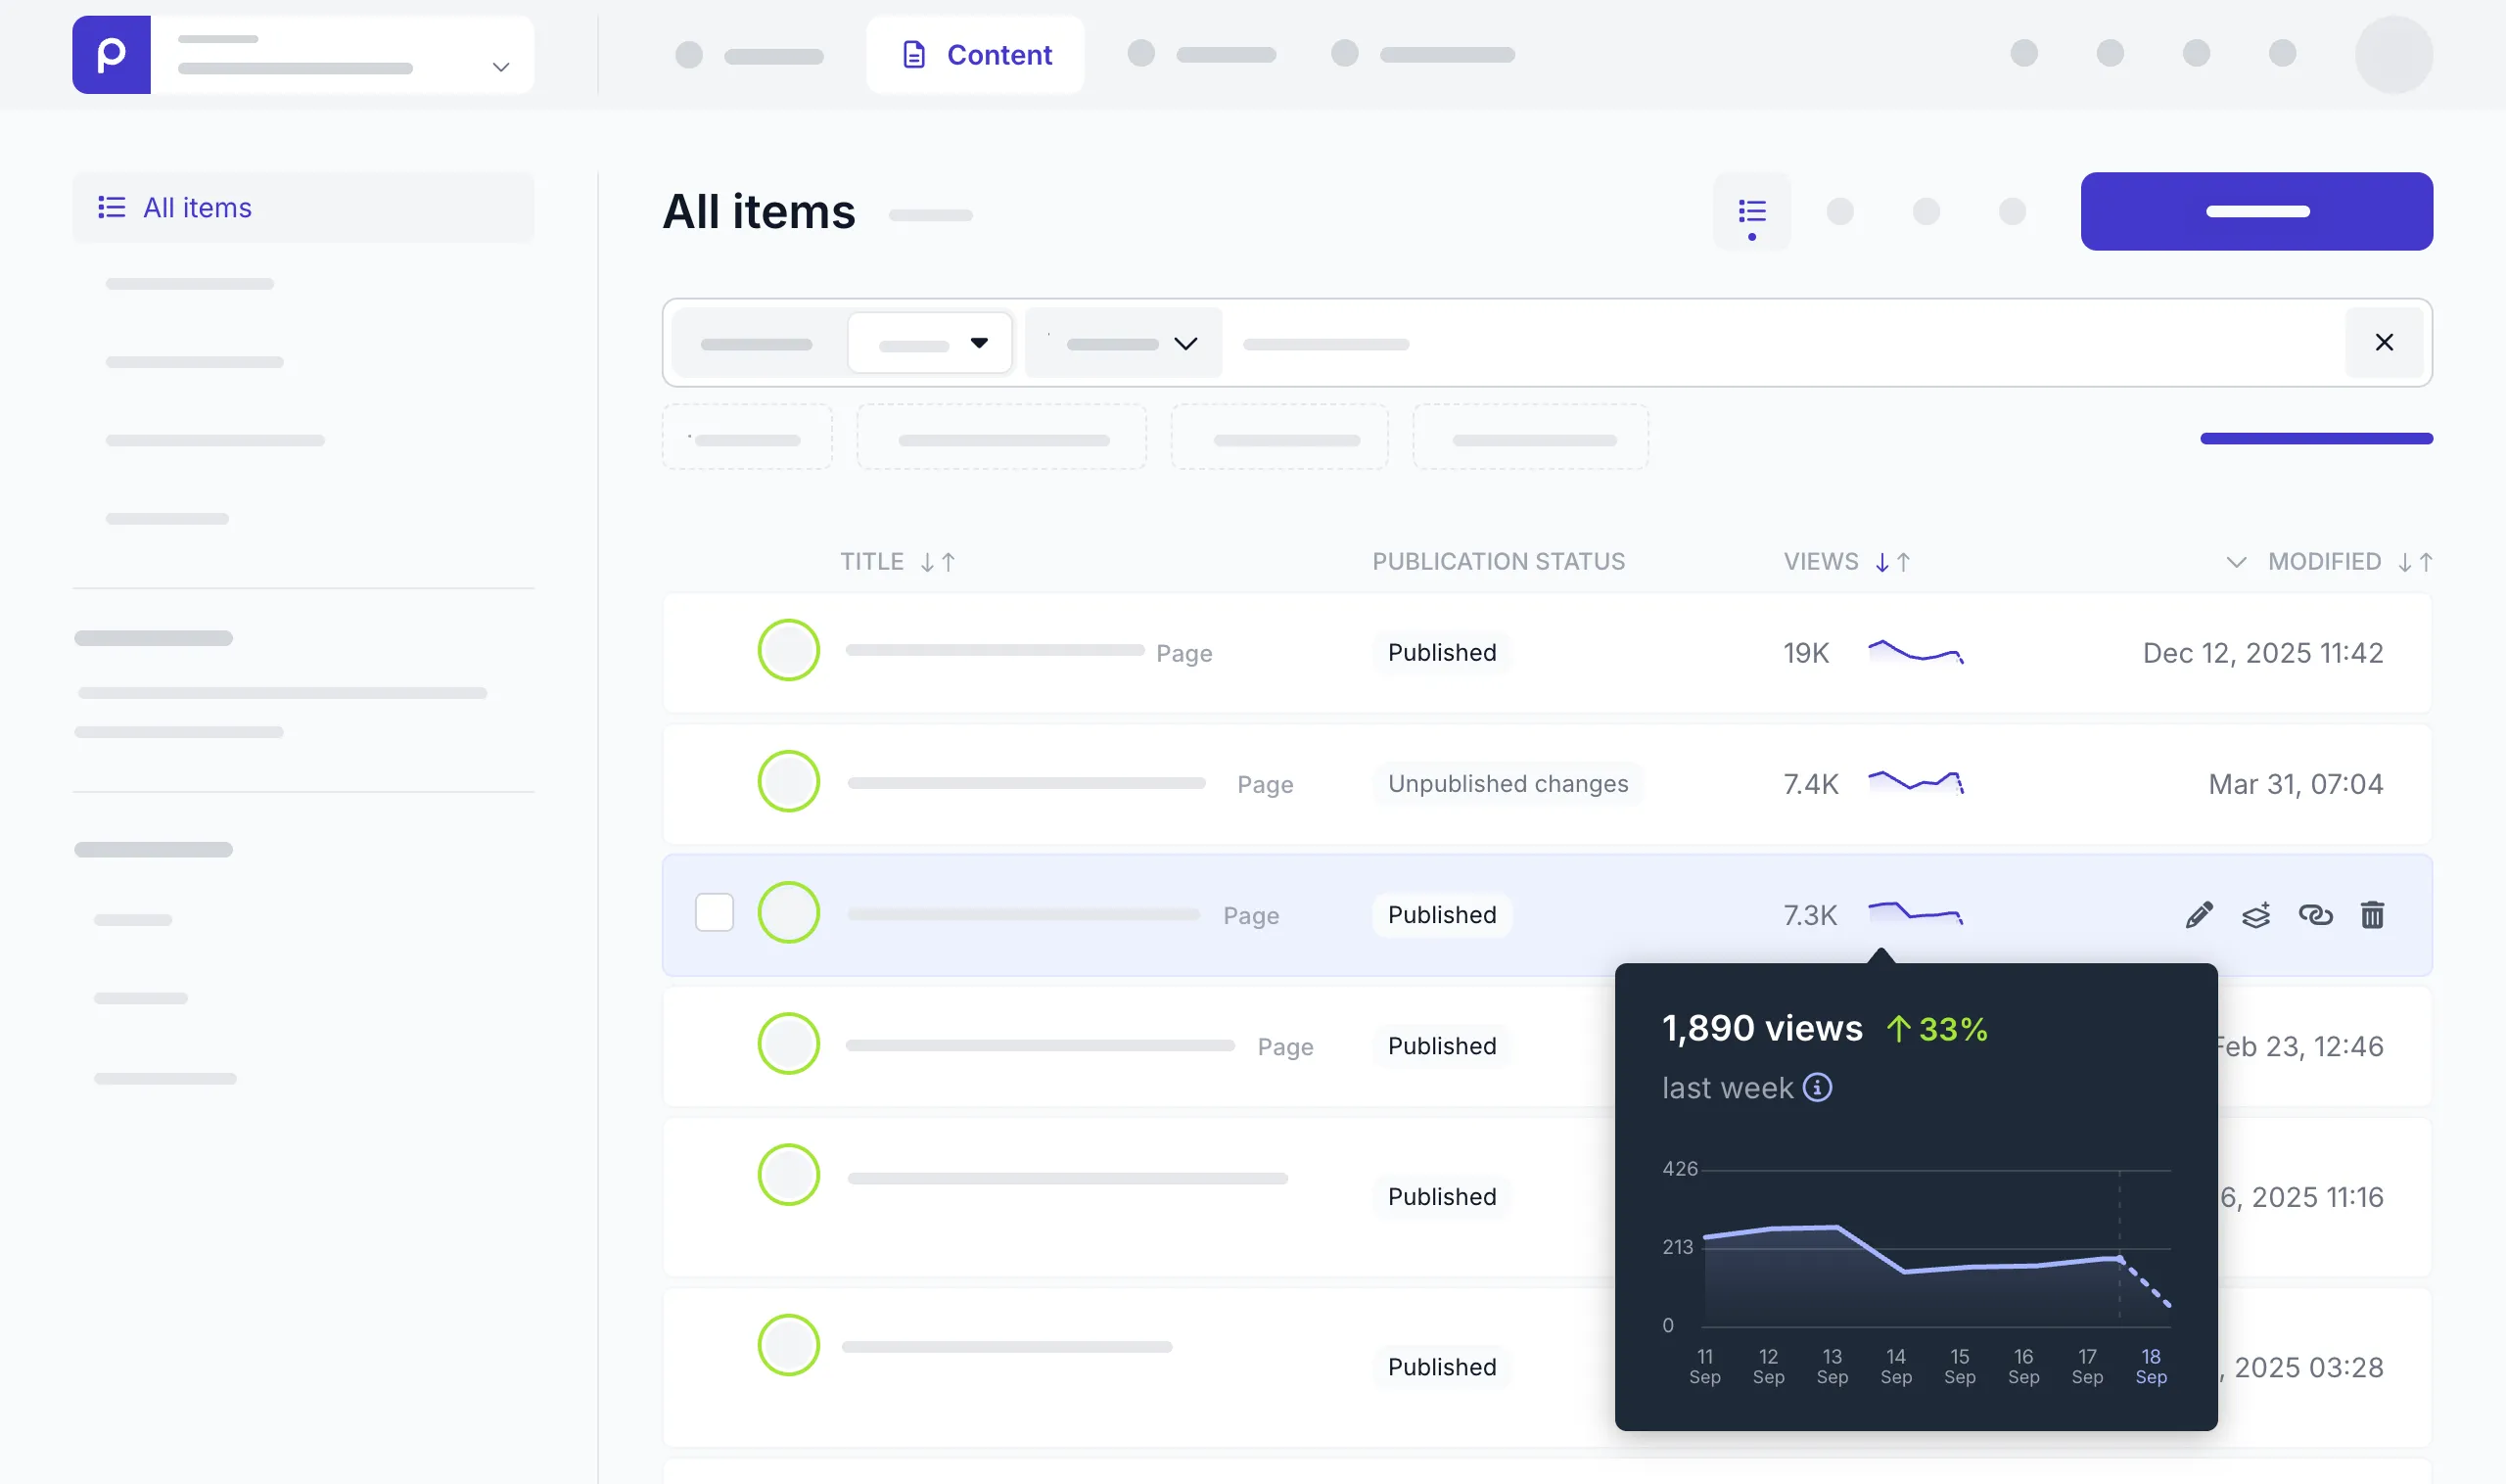
If there are no values and graphs visible, follow the steps below to set up the content item metrics.
Set up tracking
If not already implemented, request your development team to include Prepr tracking in your web app. They can set up tracking to trigger view events for specific content items.
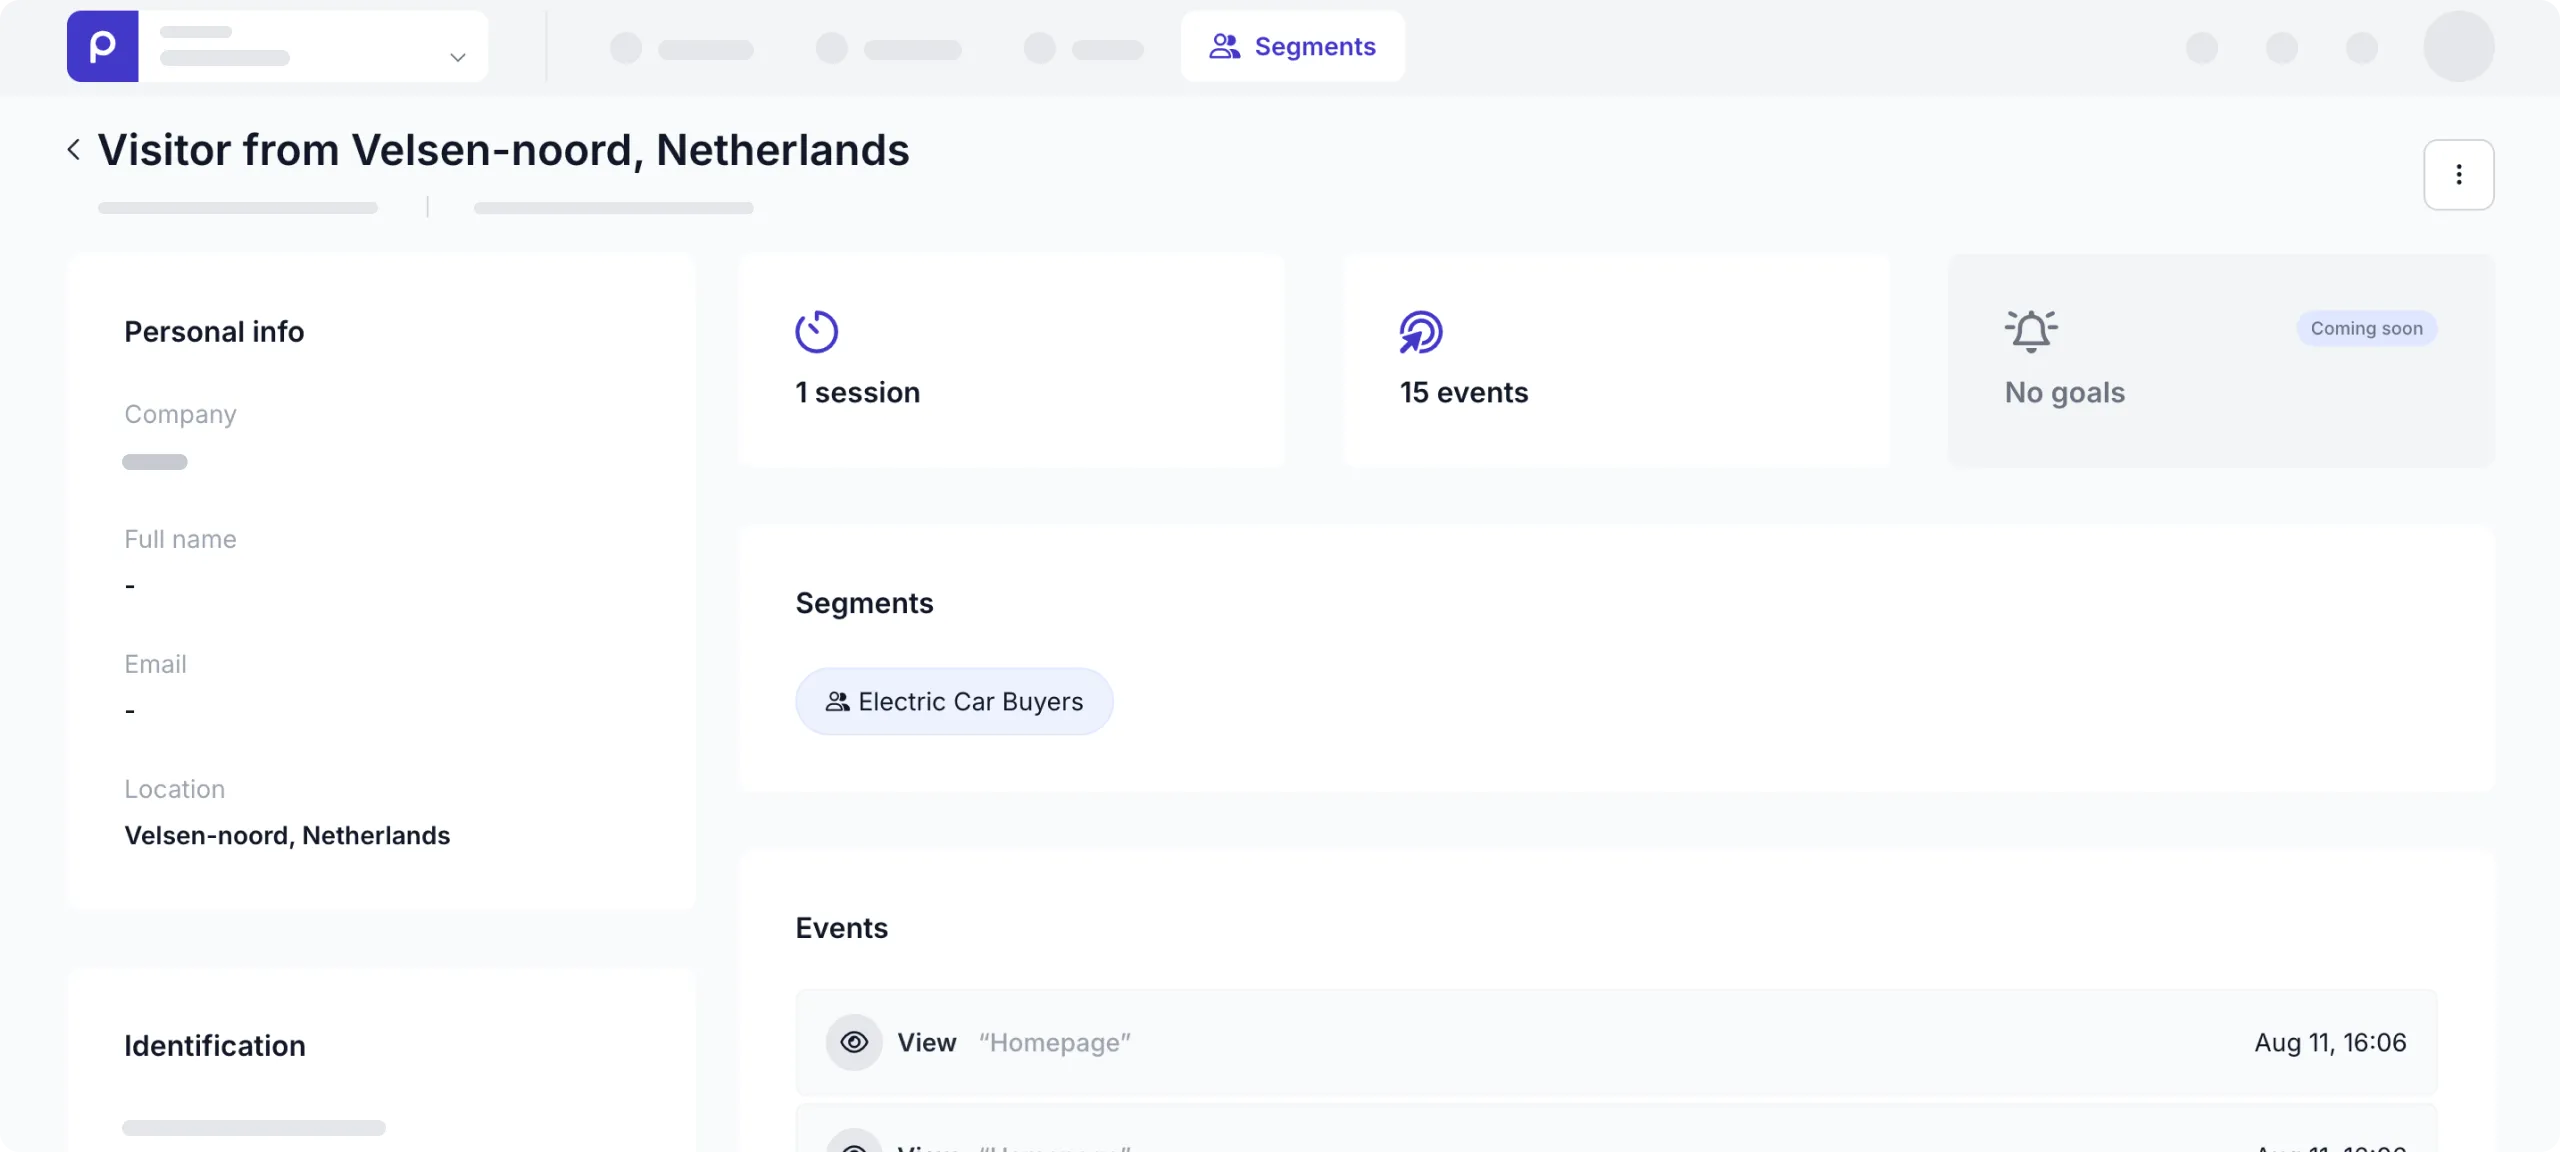
You can easily see if tracking is implemented by navigating to the Segments page in Prepr. By default, this page opens up for All visitors. By clicking on any visitor, you can see the list of events that visitor triggered.
Enable metrics per model
If tracking is implemented on the web app and you still don’t see any content metrics, then you need to enable it on the related models as follows:
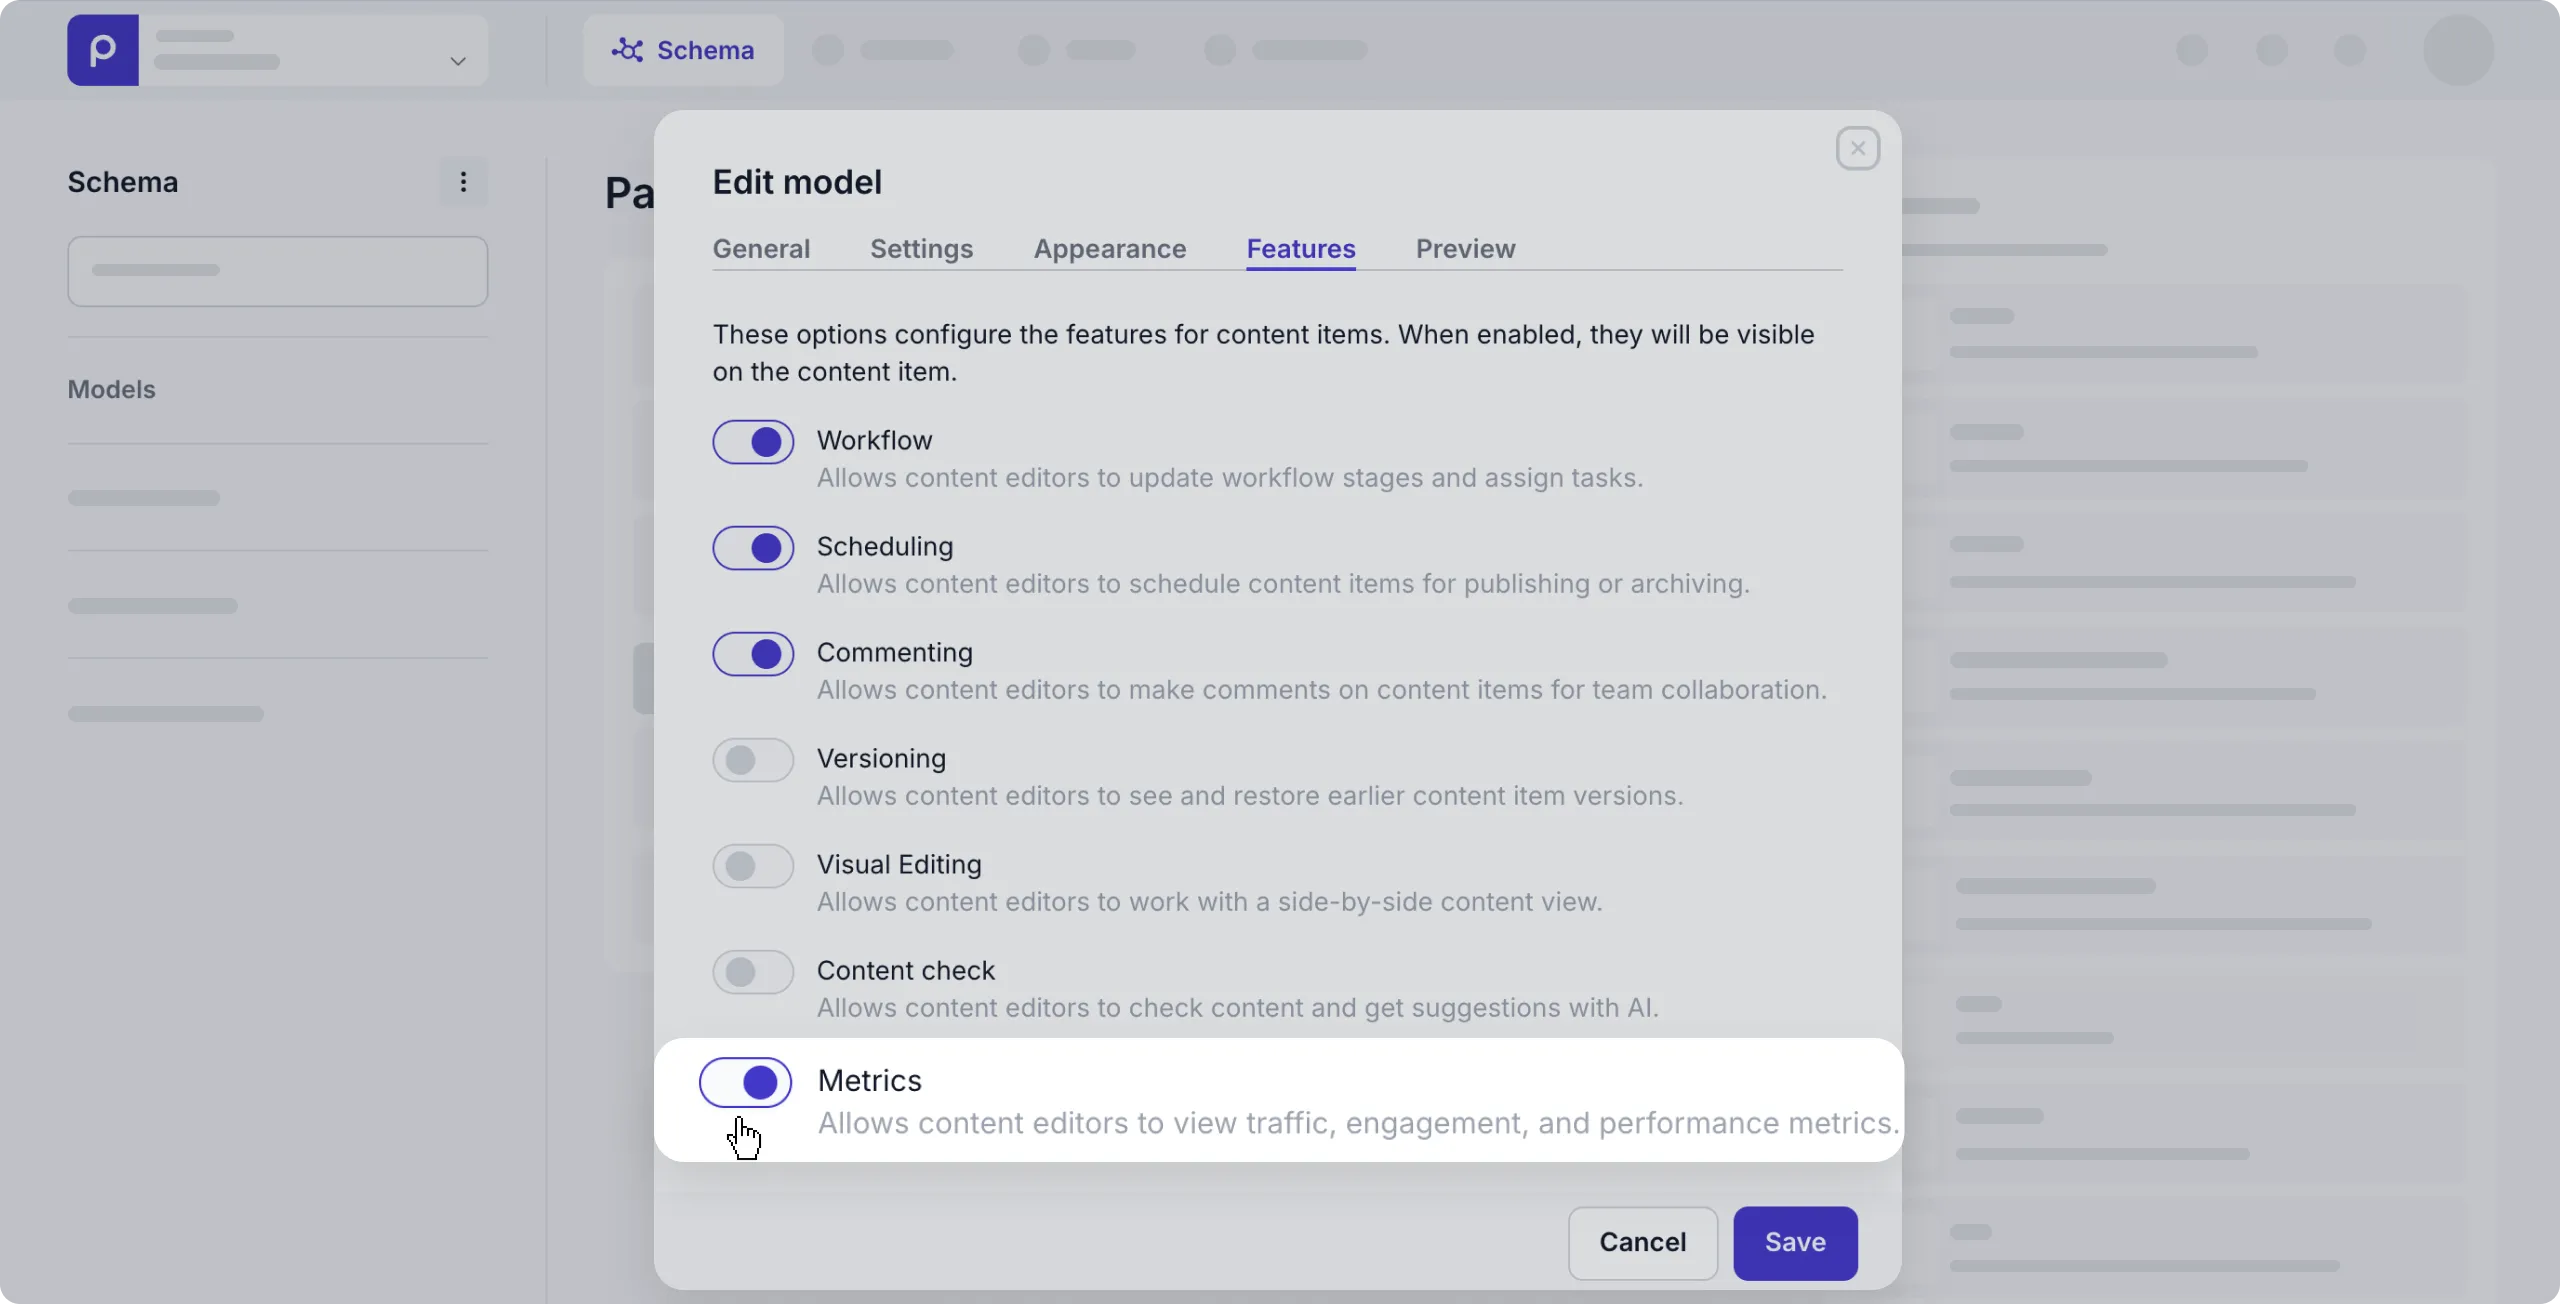
- Click the Schema tab to open the Schema Editor.
- Click the model for which you want to enable content metrics and open the Features tab.
- Enable the Metrics option and click the Save button.
If you don’t have access to the Schema page, ask your development team to enable metrics for your chosen models. For example, for articles and pages.
Once done, you’ll see content metrics in the content item list and in each relevant content item detail page.
Viewing content item metrics
You can view the content item metrics in detail by either clicking the View all metrics link from the tooltip in the content item list or directly in the content item page.

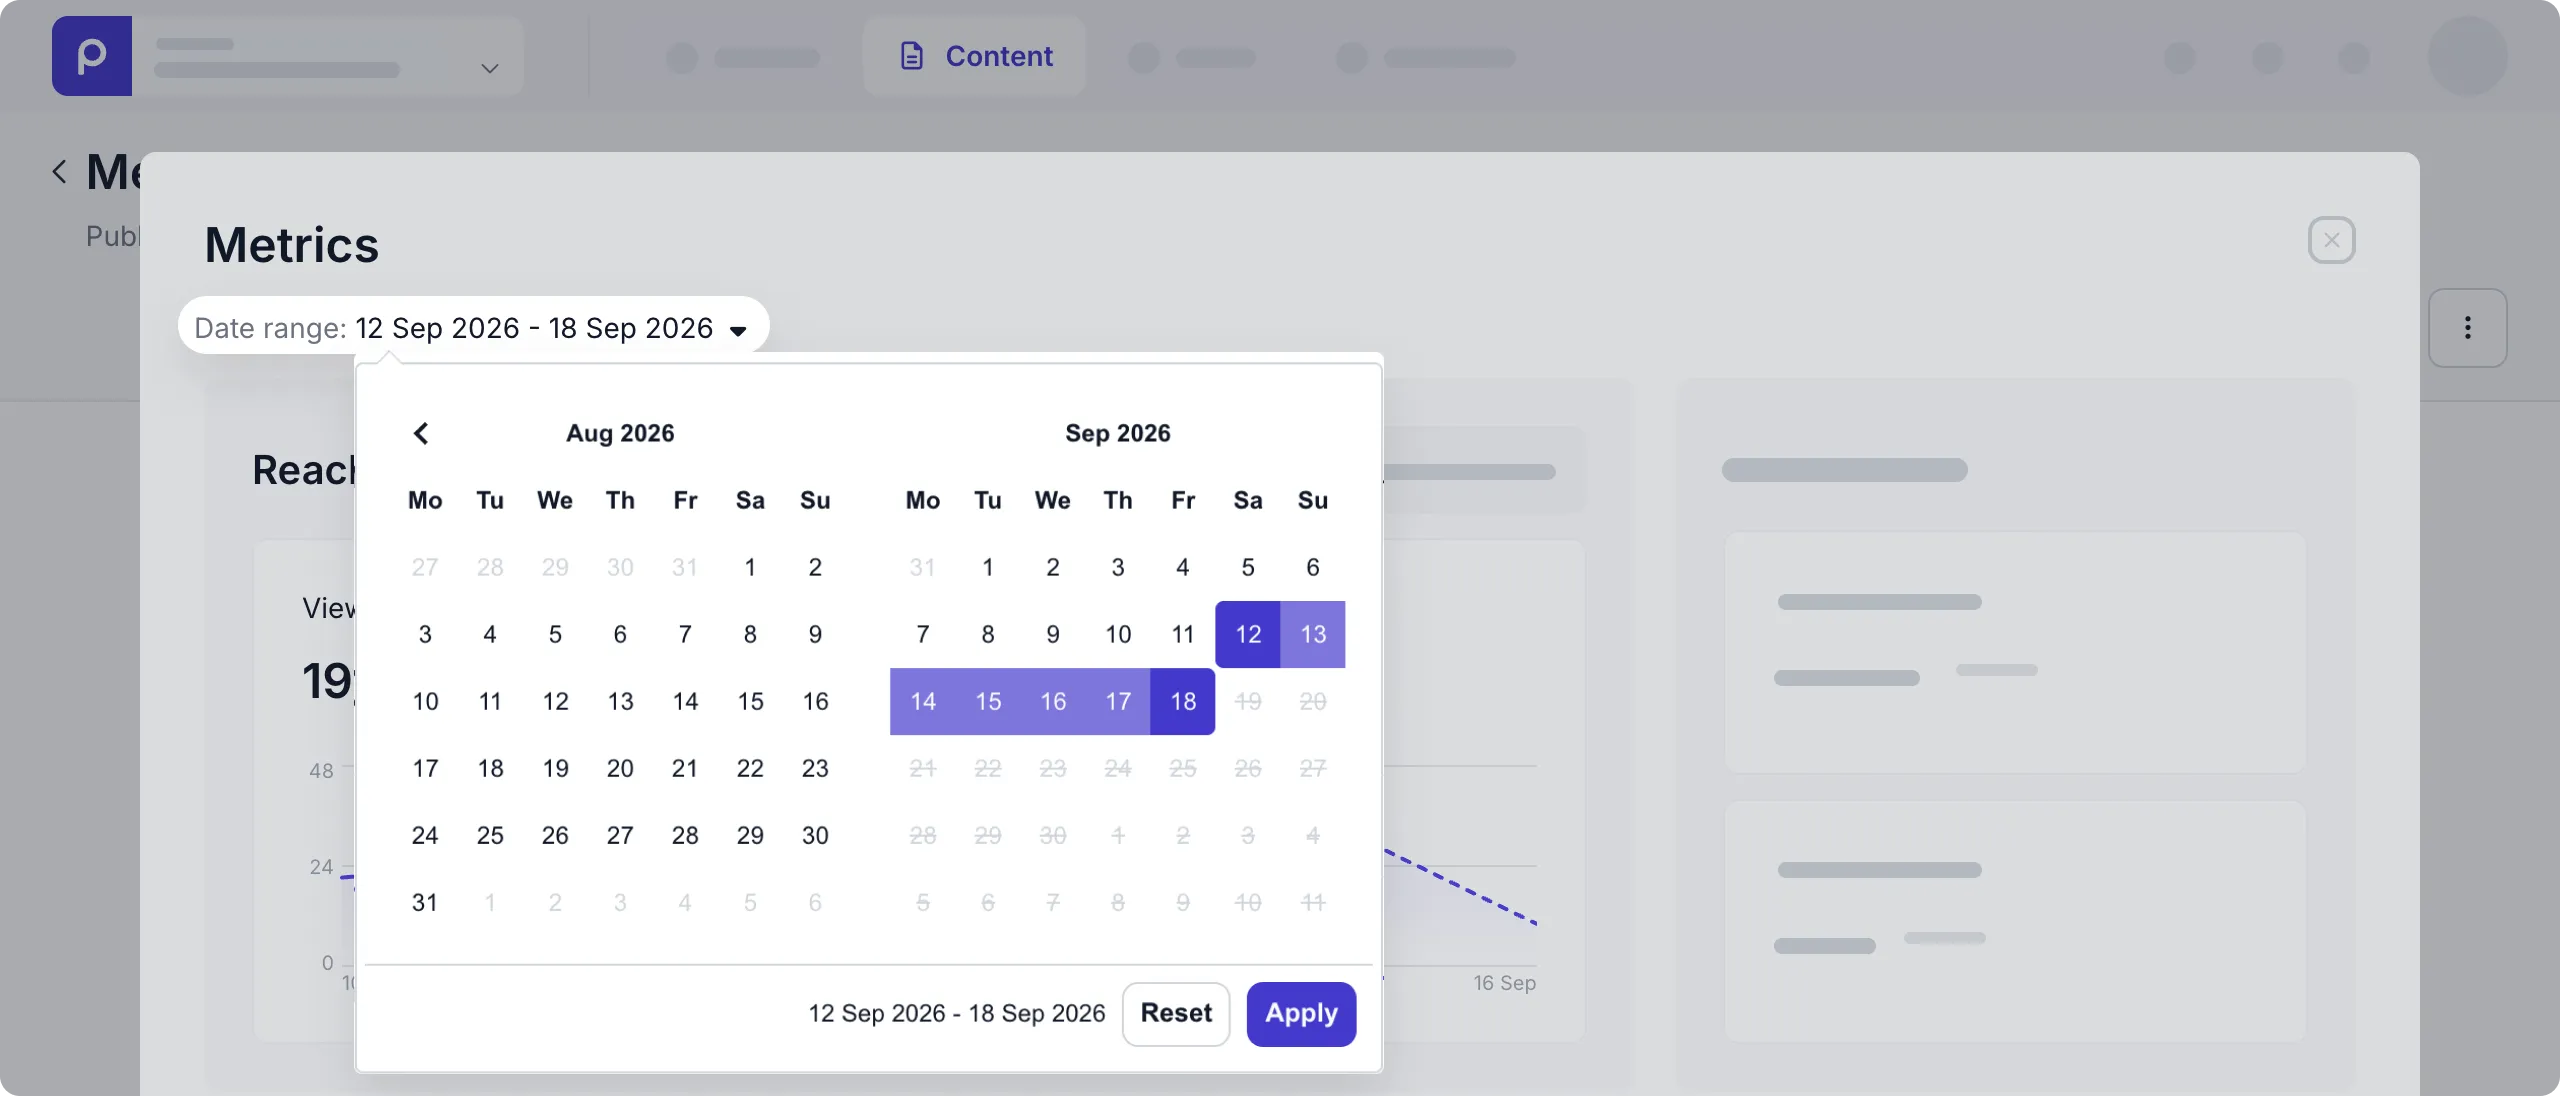
You can filter all the metrics by a custom Date range. By default, the date range is set to the last 7 days (excluding today). You can change this to any date range in the past with a maximum of 30 days.
The following metrics are available: Reach, Engagement, Events and Performance
Reach
You can determine the reach of content items from the number of times a content item is viewed during the chosen date range.
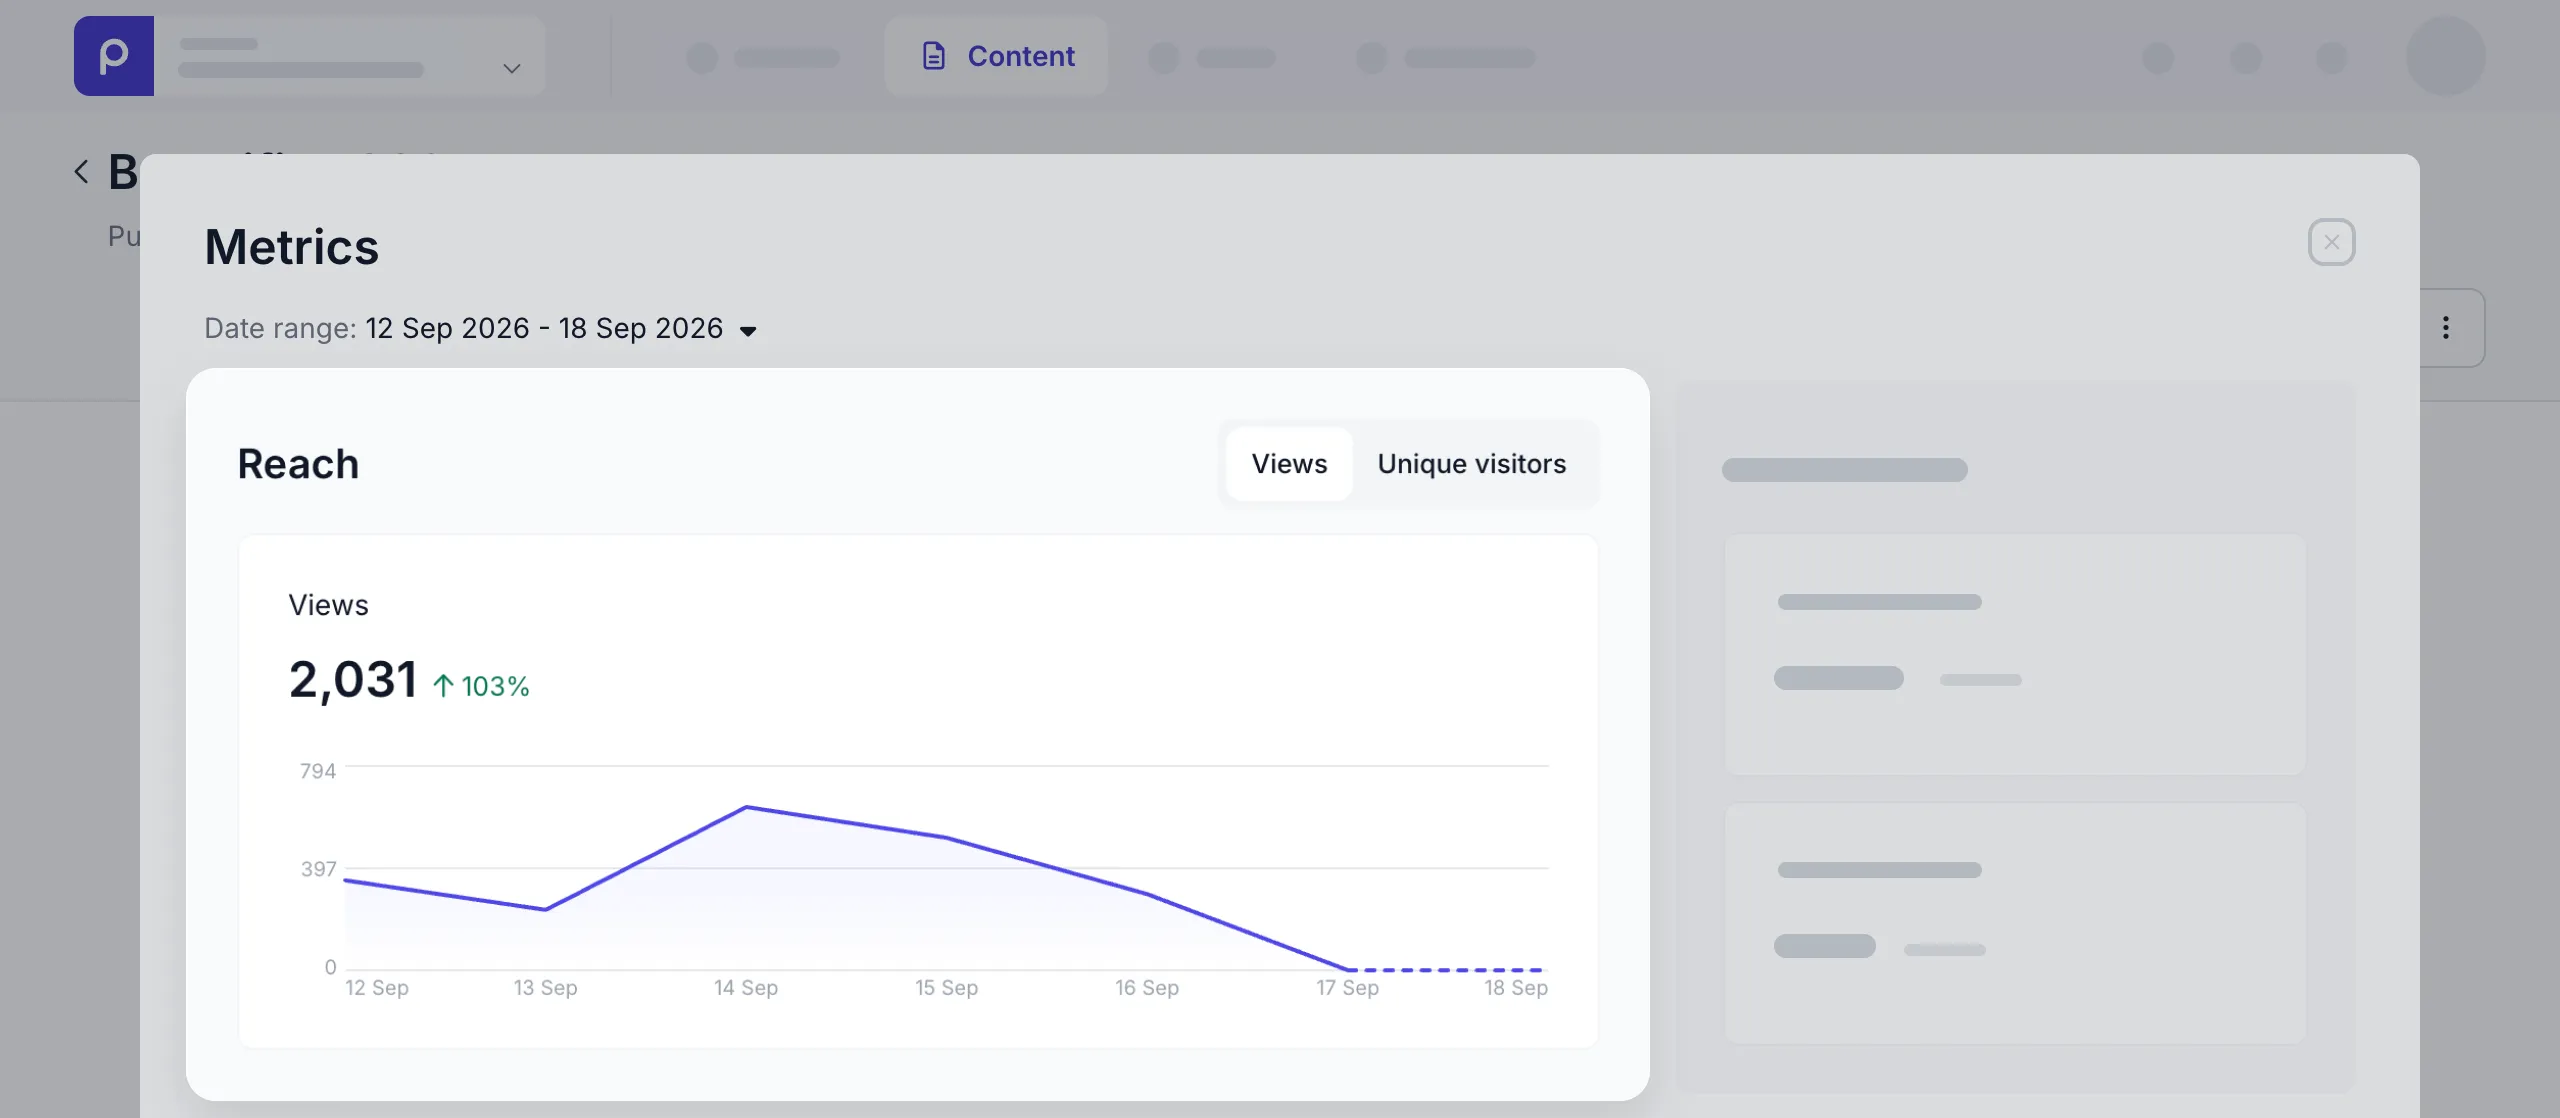
You can switch between the number of Views or number of Unique visitors. Together, they tell you how often an item was viewed and how many individual visitors those views came from. The values at the top of the graph are the average number and trend in the chosen date range. While the graph gives you a visual of the trend over the period with exact values per day.
Views
Views help you understand the size of the audience your content attracts. The number of views is the number of times this content item has been viewed by visitors.
Unique visitors
The total number of unique visitors gives you more context into the reach over the chosen date range.
| Views | Unique Visitors | Reach |
|---|---|---|
| Low | Low | Low discovery - The content struggles with search engine visibility, internal linking, and repeat engagement. |
| Low | High | Single-visit traffic - Traffic lands once to answer a quick query, then exits without exploring further. |
| High | Low | High repeat views - A core group of dedicated users relies on this page as a reference hub, returning repeatedly. |
| High | High | Broad + high retention - The page successfully attracts a wide audience and drives consistent repeat visits. |
Engagement
Engagement tells you about what happened after visitors viewed this content item.
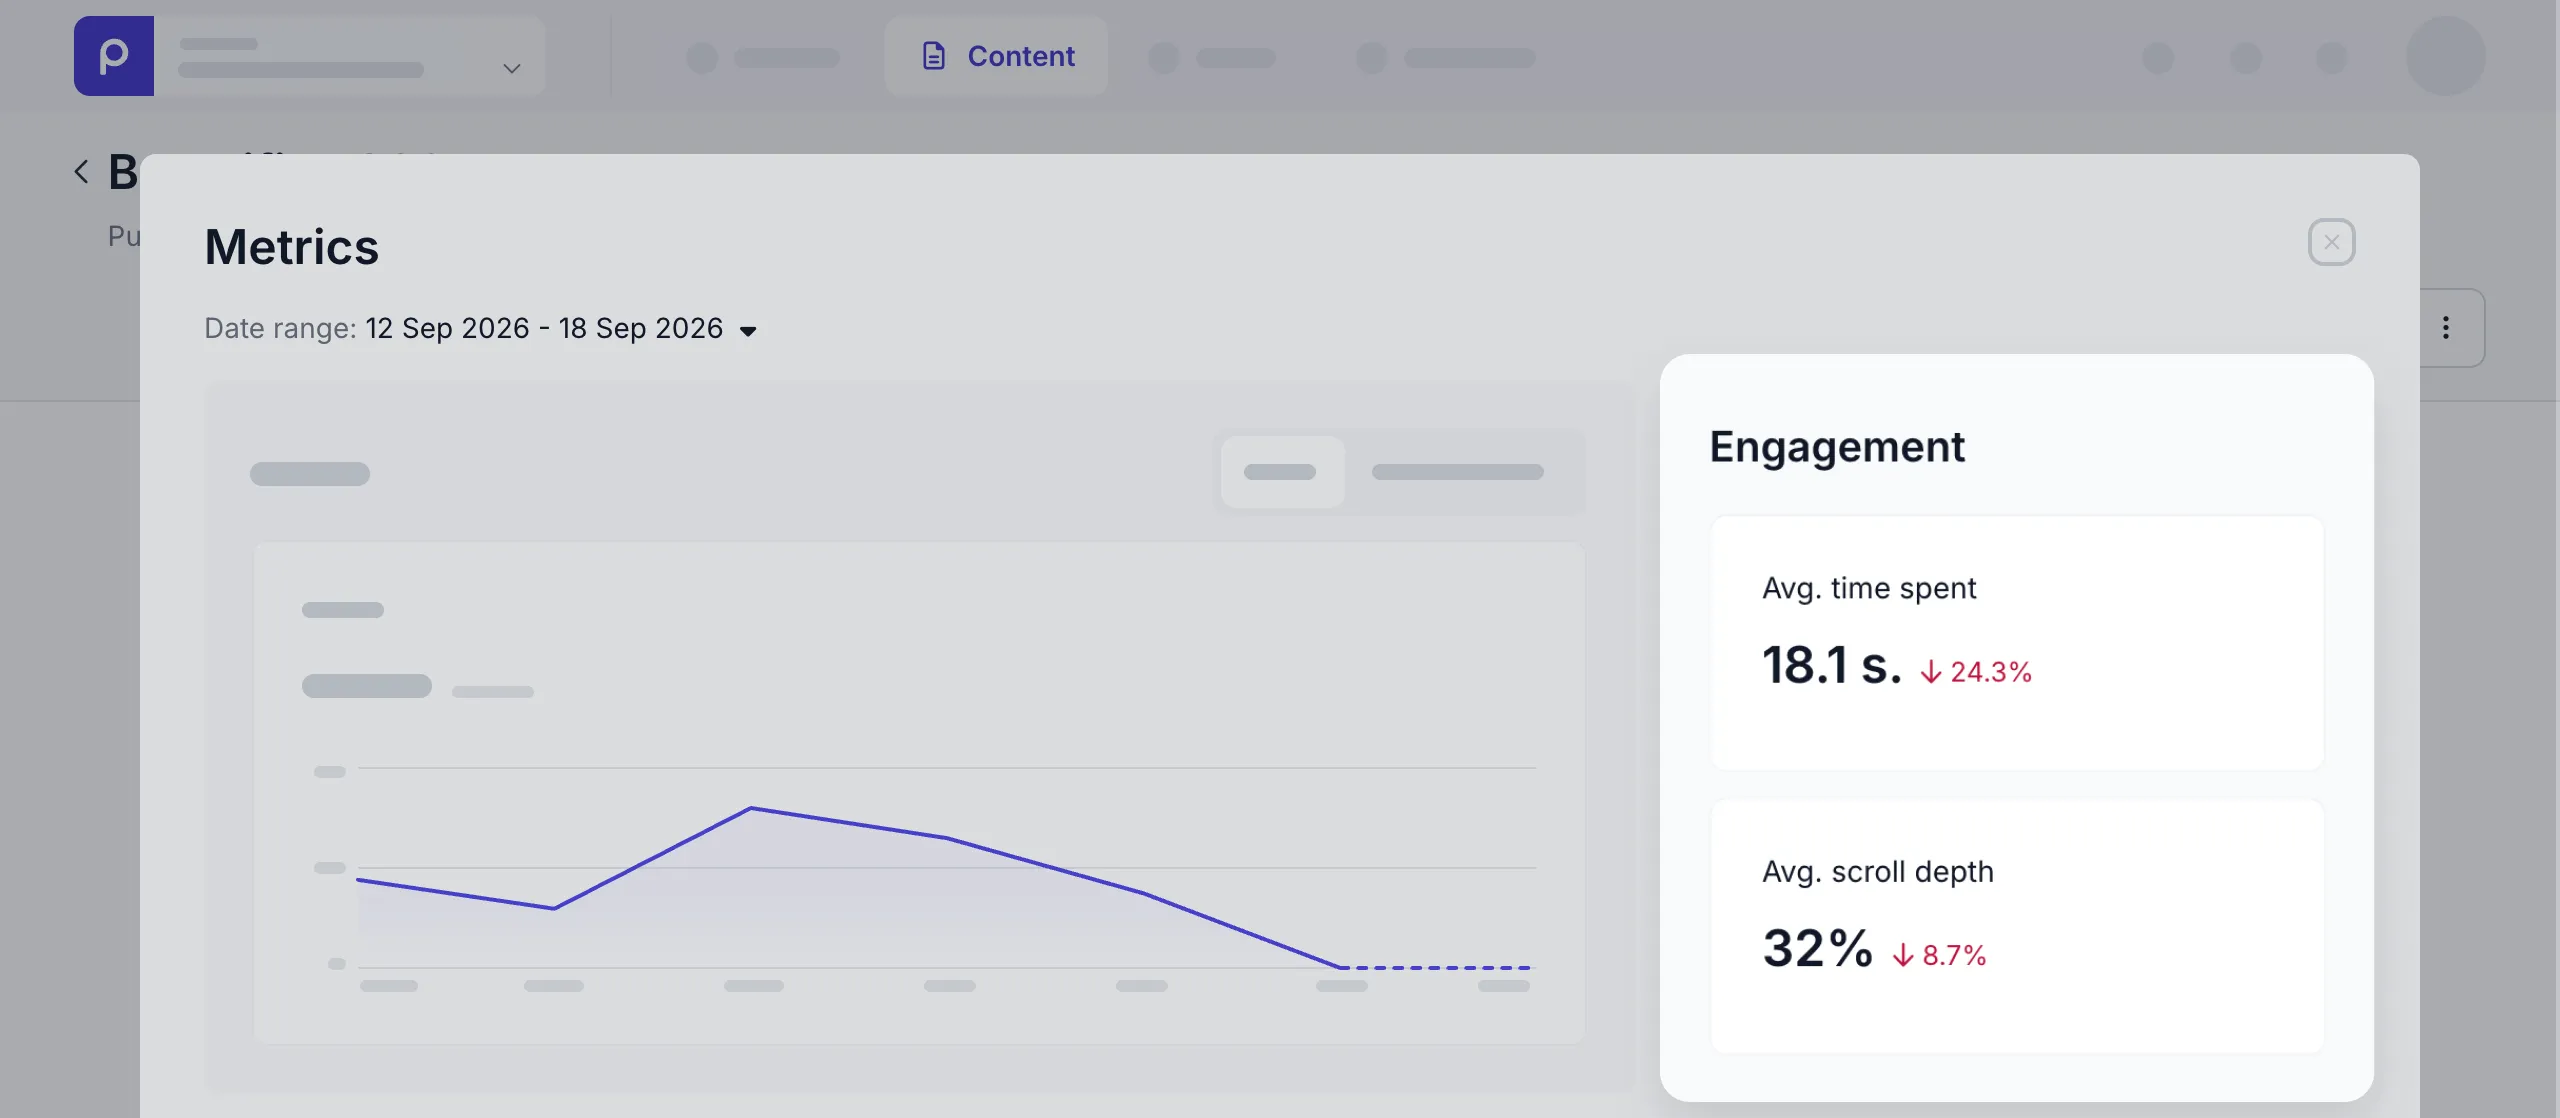
Average time spent (in seconds) and average scroll depth help you understand whether people actually engaged with the content during the chosen date range.
Avg. time spent
A higher average time spent can indicate that visitors are reading or exploring the content more thoroughly. Interpret this metric in context: shorter content may naturally require less time than a detailed article or guide.
Avg. scroll depth
The average scroll depth is how far visitors scroll through the content, represented as a percentage. A higher scroll depth suggests that visitors are reaching more of the content. If scroll depth is consistently low, consider strengthening the introduction, improving readability, or moving important information higher on the page.
Events
You can also see the number of events sent by your front end for this content item during the chosen date range.
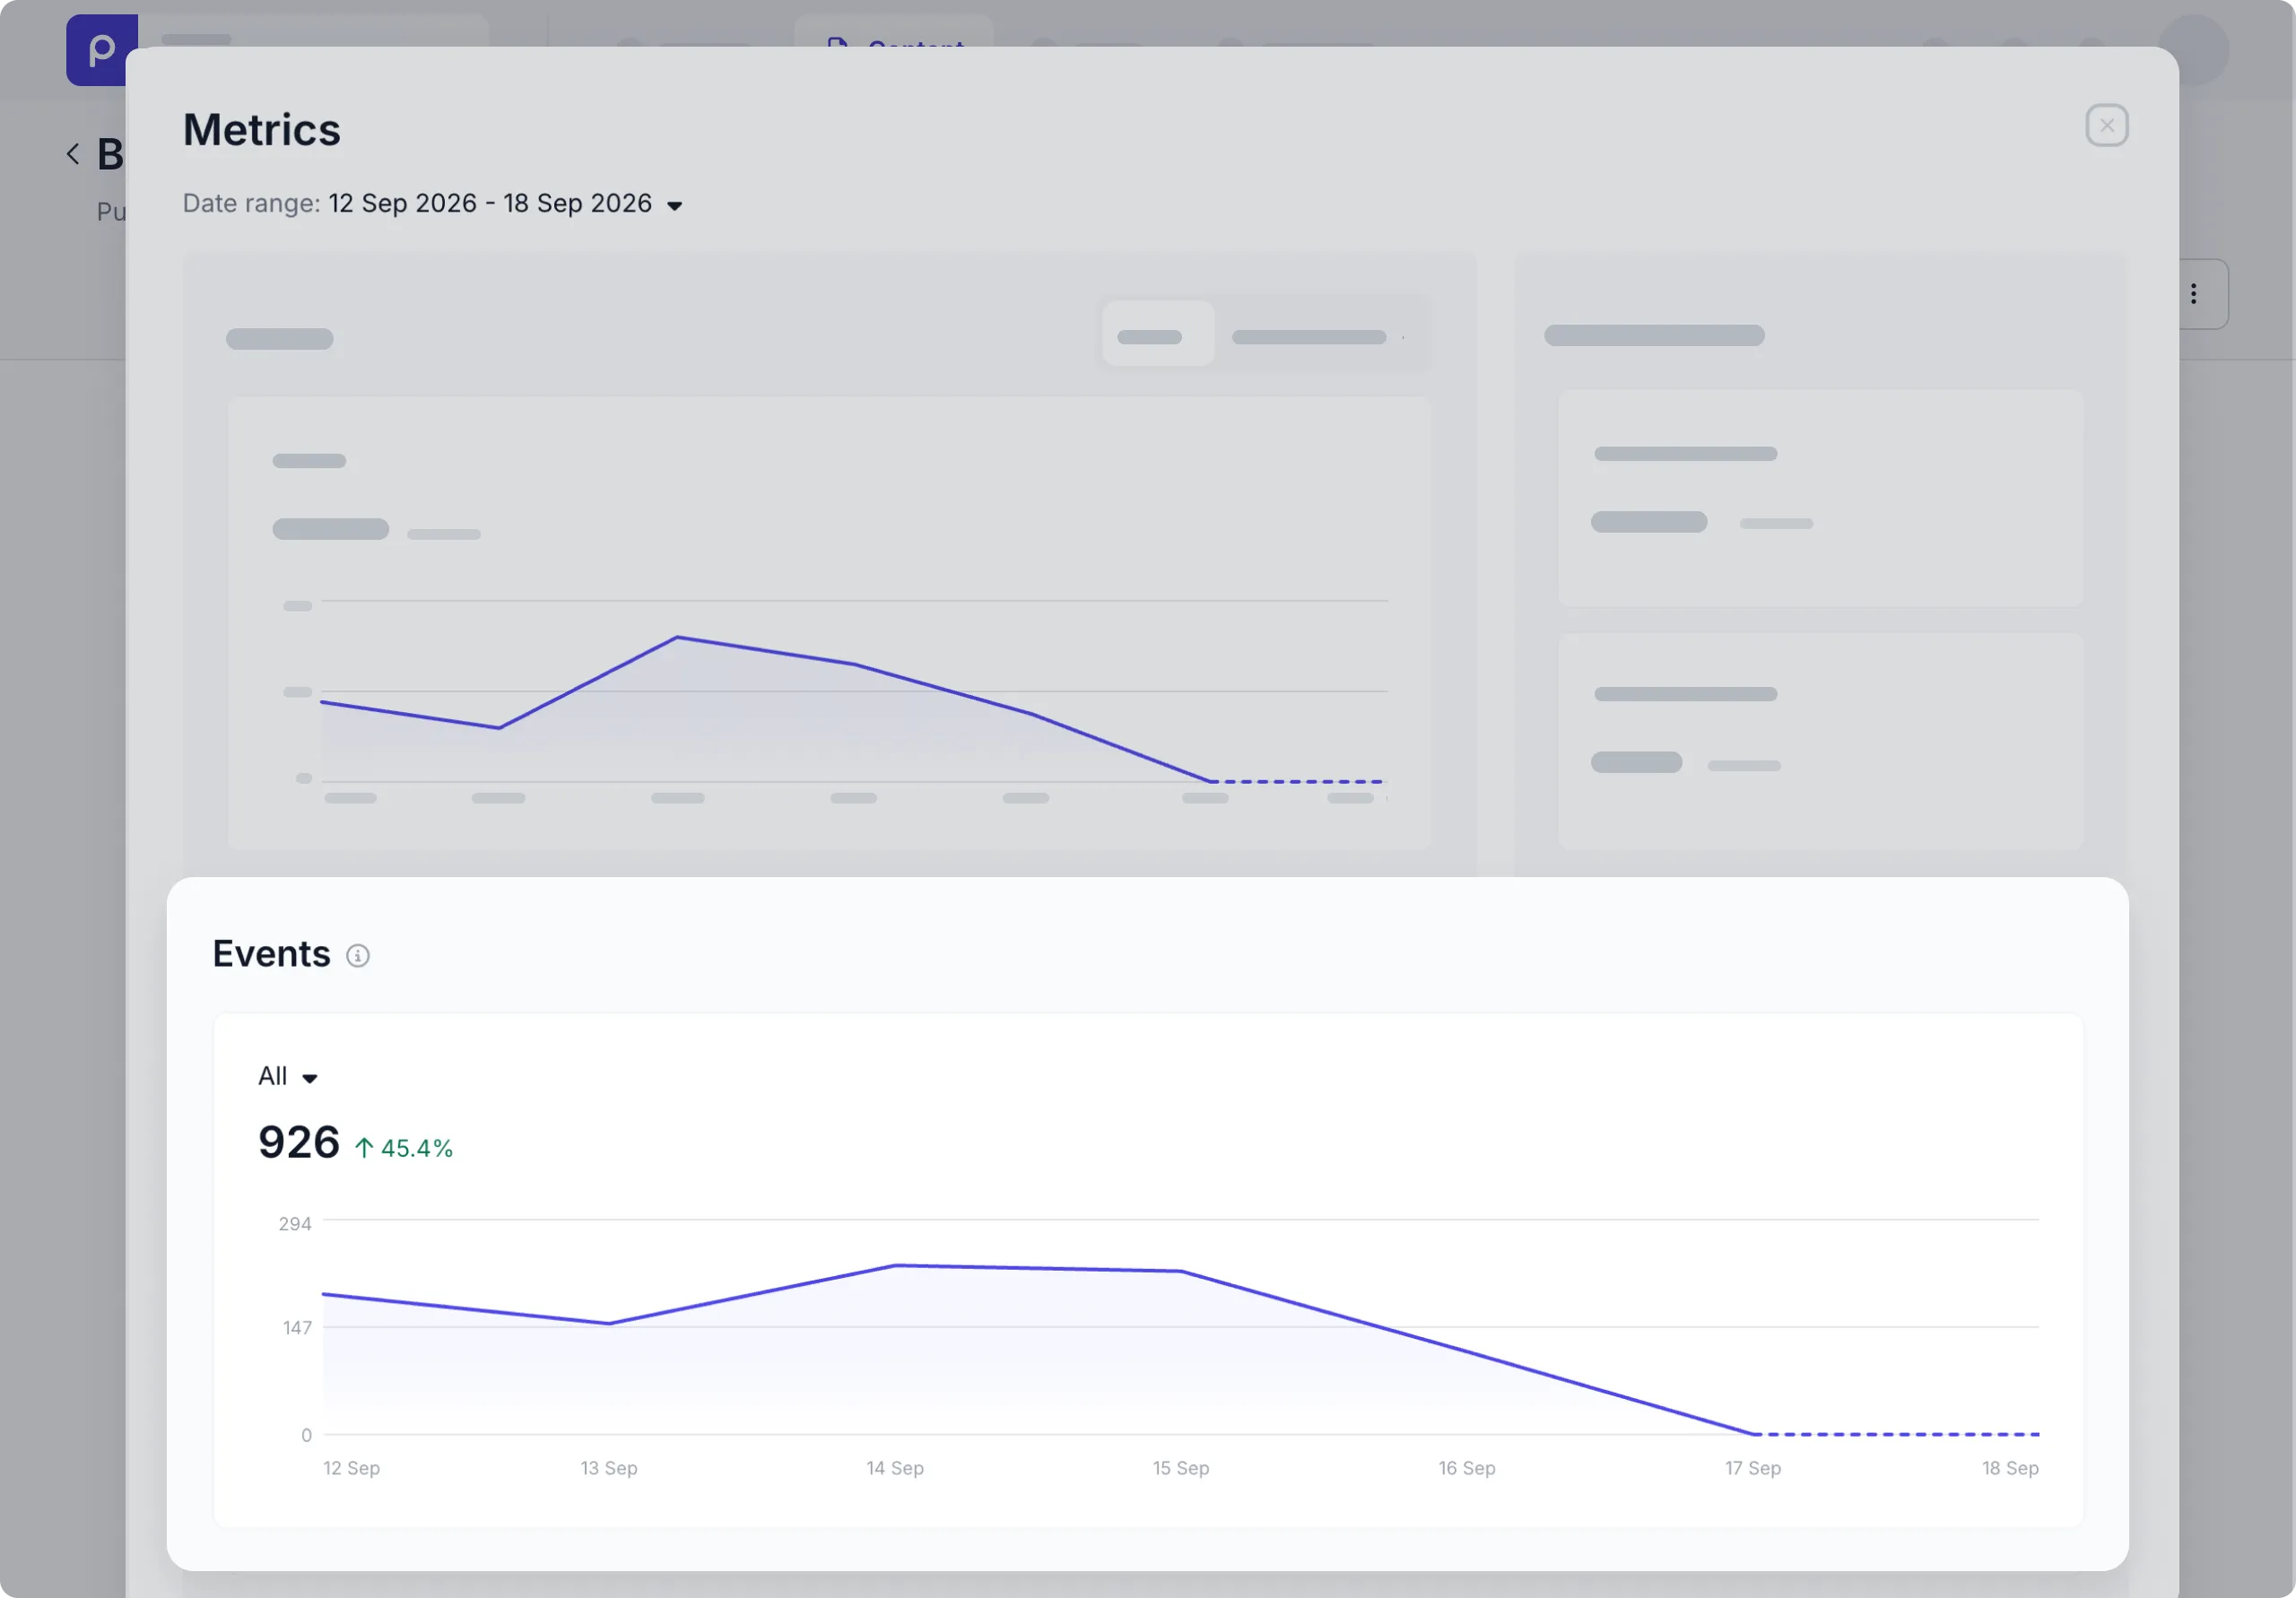
For example, a click on a call to action, a video being played, or a form being opened. You can see the number of all events that visitors perform or number of times a specific event was triggered.
The numbers at the top of the graph is the total number of events and the trend over the chosen date range. While the graph gives you a visual of the trend and specific number of events on certain days.
Performance
Performance shows whether this content item contributes to the outcomes you care about.
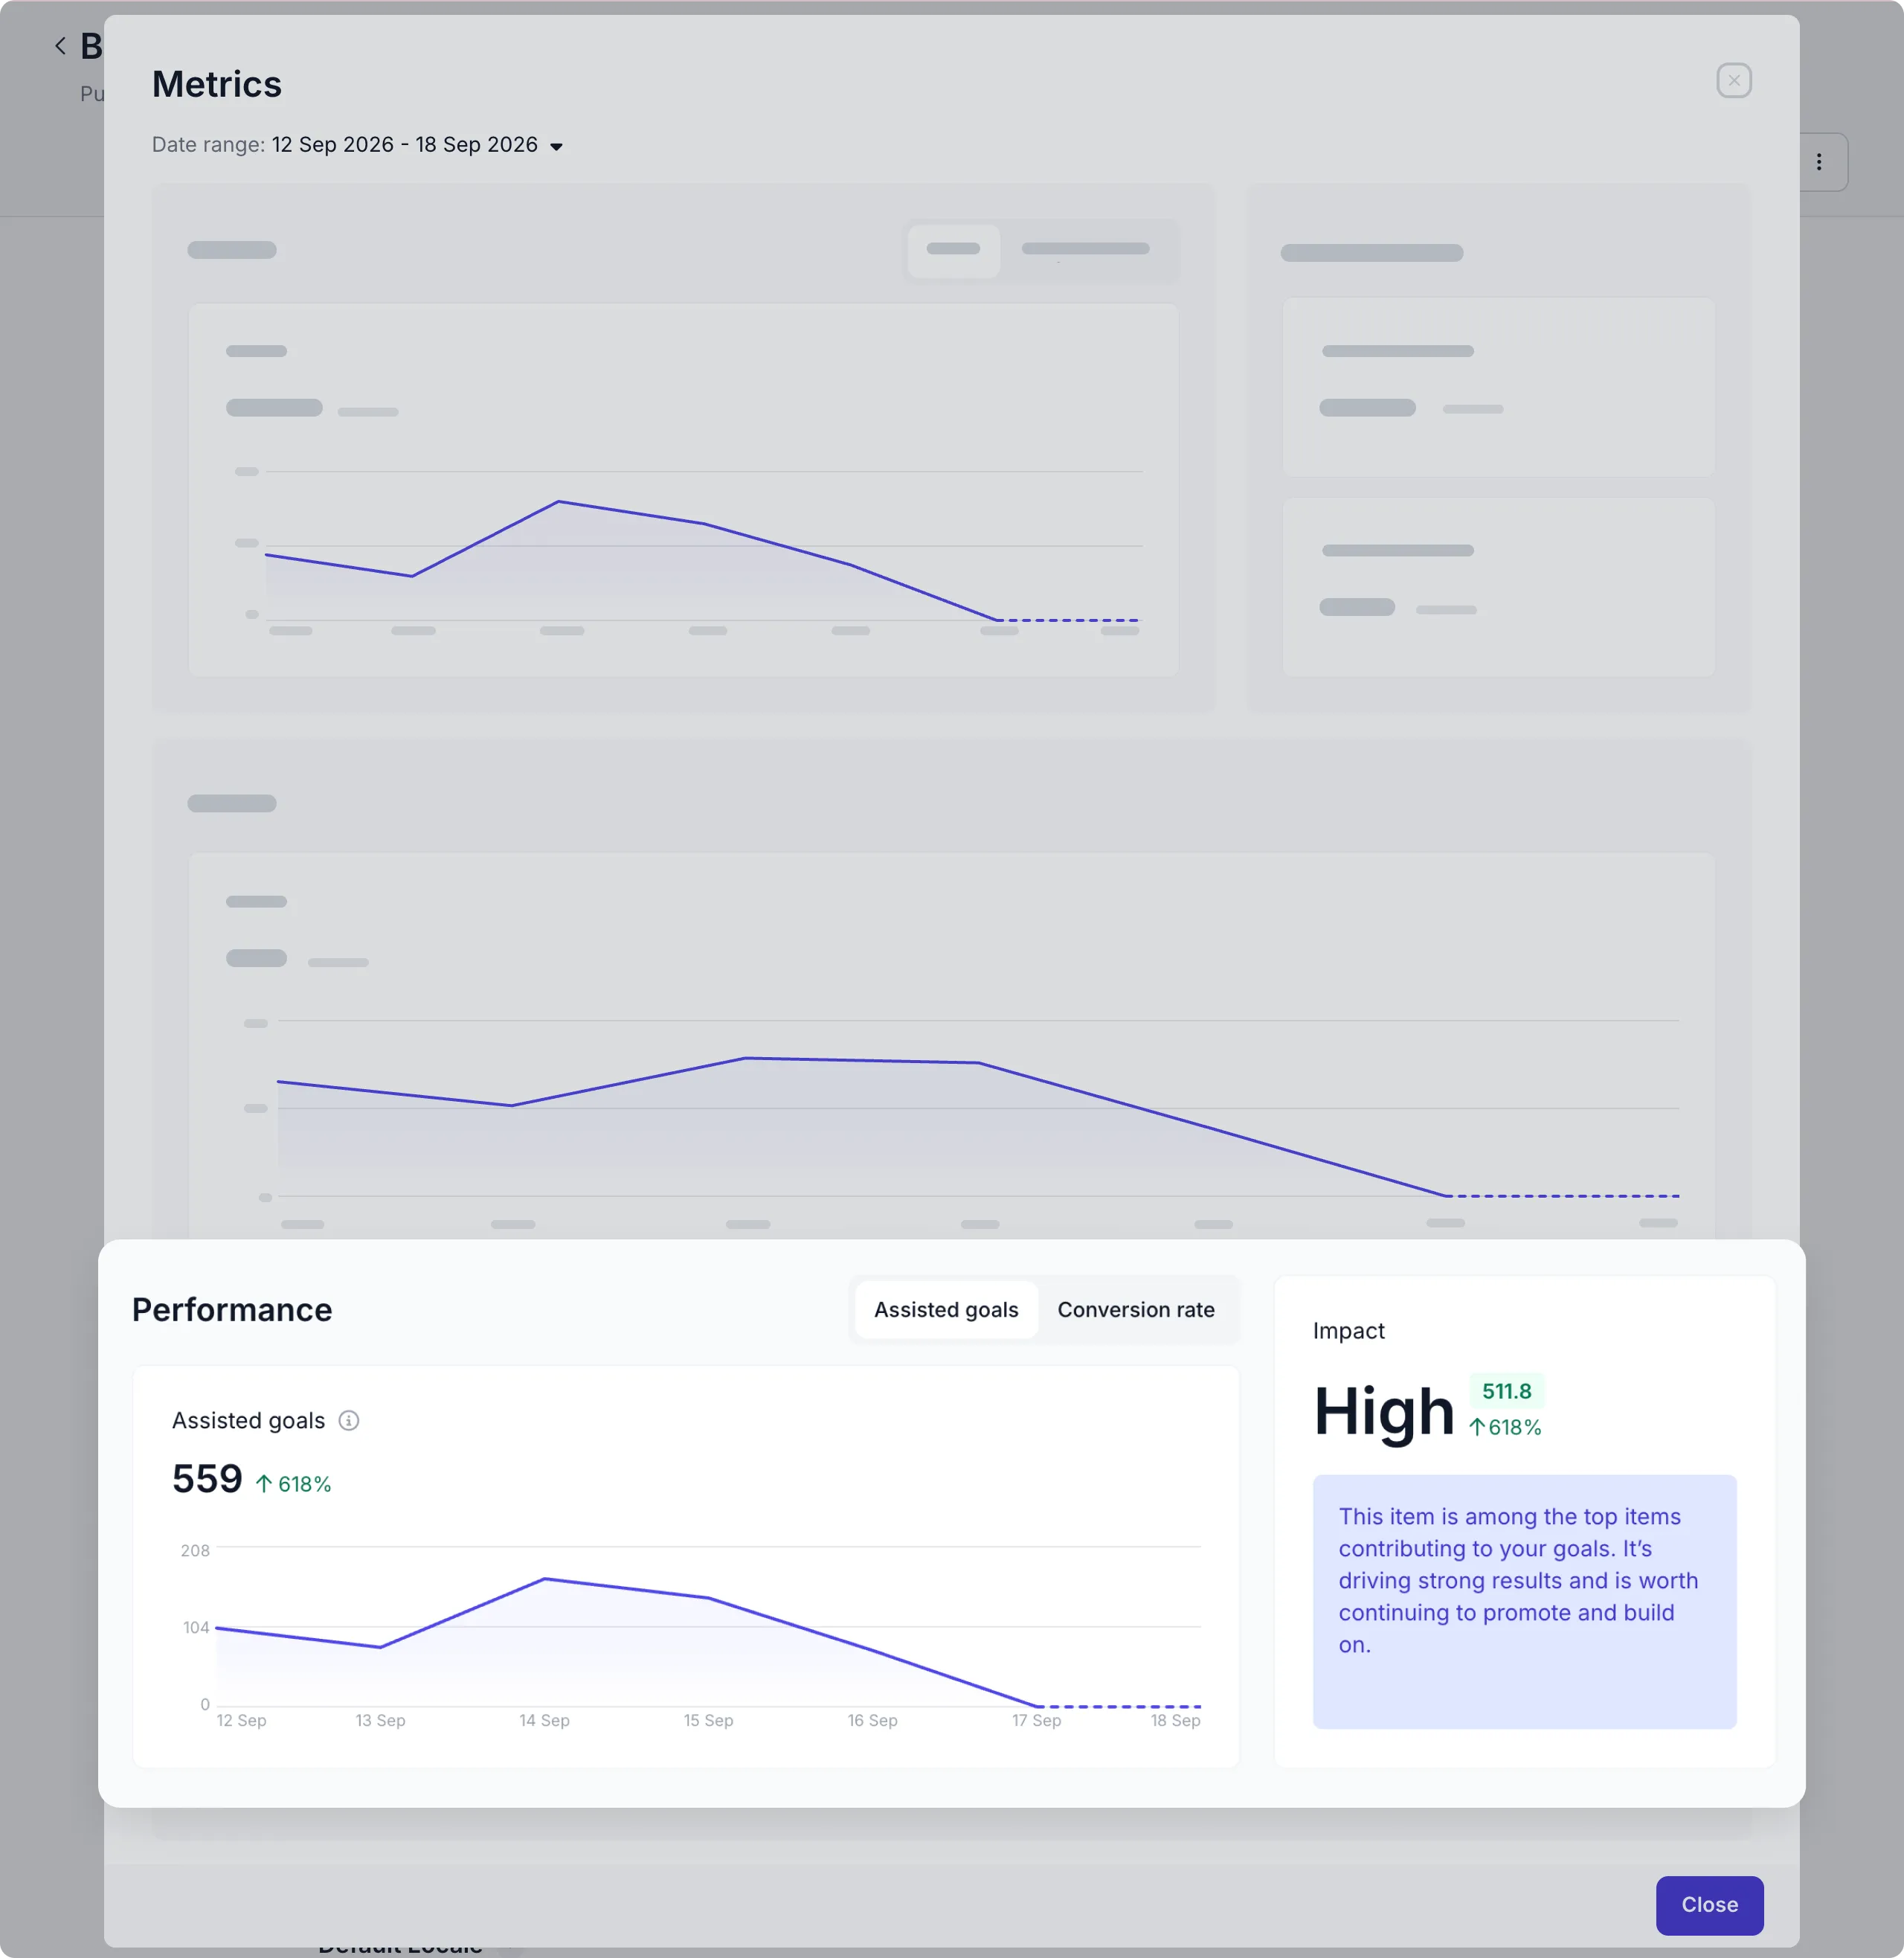
Assisted goals
A goal is a result you’ve defined for your website, such as a quote request, demo booking, or signup. Assisted goals show how many times a content item was viewed in a session that also resulted in one of those goals in the chosen date range.
Conversion rate
The conversion rate shows you the rate of the assisted goal versus the number of views. In other words, what percentage of total views resulted in completed goals.
Impact score
Impact score measures how much this content item contributed overall to achieving goals during a visitor journey. View the Impact score to get a quick understanding of how well this content performed in the chosen date range.
A High impact score means this content item is in the top 20% of all content contributing to goals during the chosen date range.
For more insight into content metrics in the context of real-life visitor journeys, check out our Content metrics blog .